Interpretation of Financial Ratios
Liquidity Ratios
This class of financial ratios help you to evaluate your company's ability or strength to pay off its liabilities which are going to be due in the next 12 months, barring it from any external capital infusion.
Current Ratio–The Company has a current ratio of 14.65 in month 12. The ideal current ratio a 2:1, but the e-commerce industry has an average of 2.27.
Acid test Ratio – The Company has an acid test ratio of 14.06 in month 12. The ideal acid test ratio a 1:1, but the e-commerce industry has an average of 1.18.
Cash Ratio –The Company has a cash ratio of 13.93 in month 12. The ideal cash ratio ranges between 0.5-1, but the e-commerce industry has an average of 0.56.
Leverage Ratios
This class of financial ratios help you to evaluate how your company's assets or operations are financed.
Debt to Asset Ratio–The Company has a debt to asset ratio of 0.09 in the month 12.The ideal debt to asset ratio ranges between 0.3-0.6, and the e-commerce industry has an average of 1.16.
Debt Equity Ratio – The Company has a debt to asset ratio of 0.10 in month 12. The ideal debt-equity ratio ranges between 0.5-1.5, but the e-commerce industry has an average of 2.32.
Interest Coverage Ratio –The Company has an interest coverage ratio of 2456 in month 12. The ideal interest coverage ratio is assumed to be 2, but the e-commerce industry has an average of -102.35.
Efficiency Ratios
This class of ratios measures how well the company is utilizing its assets to generate its revenue.
Debt to Asset Ratio–The Company has an asset turnover ratio of 0.24 in month 12. The ideal asset turnover ratio is assumed to be greater than 2.5, but the e-commerce industry has an average of 3.
Inventory Turnover Ratio –The Company has an inventory turnover ratio of 1.39 in month 12. The ideal inventory turnover ratio is assumed to be greater than 4, but the e-commerce industry has an average of 5.
Receivables Turnover Ratio – The Company has a receivable turnover ratio of 20.72 in month 12. The ideal receivables turnover ratio is assumed to be greater than 2.5, but the e-commerce industry has an average of 4.
Payables Turnover Ratio – The Company has a payables turnover ratio of 1.35 in month 12. The ideal payables turnover ratio is assumed to be within the range of 1.5-2, but the e-commerce industry has an average of 1.7.
Days Sale in Inventory – The Company has a day's sales in inventory turnover ratio of 263 days in the month 12. The ideal day's sale in inventory ratio is assumed to be within the range of 0-90 days, but the e-commerce industry has an average of 85.
Receivable Days – The Company has a receivable day's ratio of 18 days in the month 12. The ideal receivable day's ratio is assumed to be within the range of 090 days, but the e commerce industry has an average depending upon the type of products in the range of 30-50 days.
Payable Days – The Company has a payable day's ratio of 271 days in the month 12. The ideal payable day's ratio is assumed to be within the range of 0-120 days, but the e-commerce industry has an average depending upon the type of products in the range of 60-90 days.
Profitability Ratios
This class of financial metrics evaluates the performance of the company about the generation of sales from its core operations. These metrics emphasize a business' return in the assets and the inventory.
Gross Profit Margin–The Company has a gross profit margin of 76% in month 12. The ideal margin is assumed to be around 65%, which is above the average.
Operating Profit Margin –The Company has an operating profit margin of 69% in month 12. The ideal margin is assumed to be around 65%, which is above the average.
Net Profit Margin – The Company has a net profit margin of 68% in month 12. The ideal margin is assumed to be around 8%, which is very high from the average.
Return on Assets Ratio – The Company has a return on asset ratio of 4% in month 12. The ideal margin is assumed to be around 5%, which is below the average.
Return on Equity Ratio – The Company has a return on equity ratio of 24% in month 12. The ideal margin is assumed to be around 15%, which is above the average.
Price Discounting
Companies cut prices primarily to improve their sales volume. However, the majority of the managers do not consider the profit implications. Discounting might become ingrained in your company's culture. It's possible that this might not be a good thing!
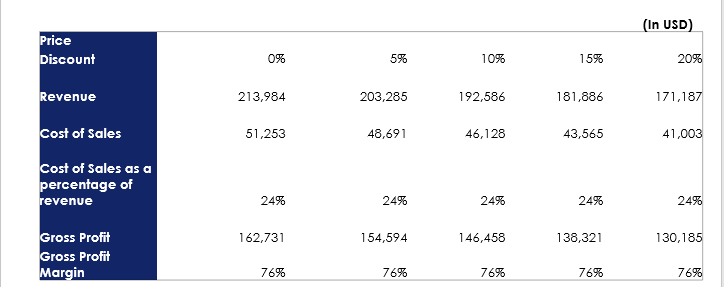
The below table demonstrates our workings based on a scenario where a customer places an order for $427,968

Therefore, the company would need to achieve the following sales level to maintain your original margin of $325,461.


